How to Check Your Website's CPU and Memory Usage in cPanel
Last updated Changelog
On this page
Your hosting plan gives your website a share of the server’s processing power (CPU), memory and processes. If your site needs more than its share, it slows down or shows an error. Here’s how to see what it uses. For disk space, see Check your disk usage.
Quick look: the home page
Log in to cPanel. The Statistics box on the right of the home page shows your current CPU Usage, Entry Processes, Physical Memory Usage and Number Of Processes, each next to your plan’s limit.
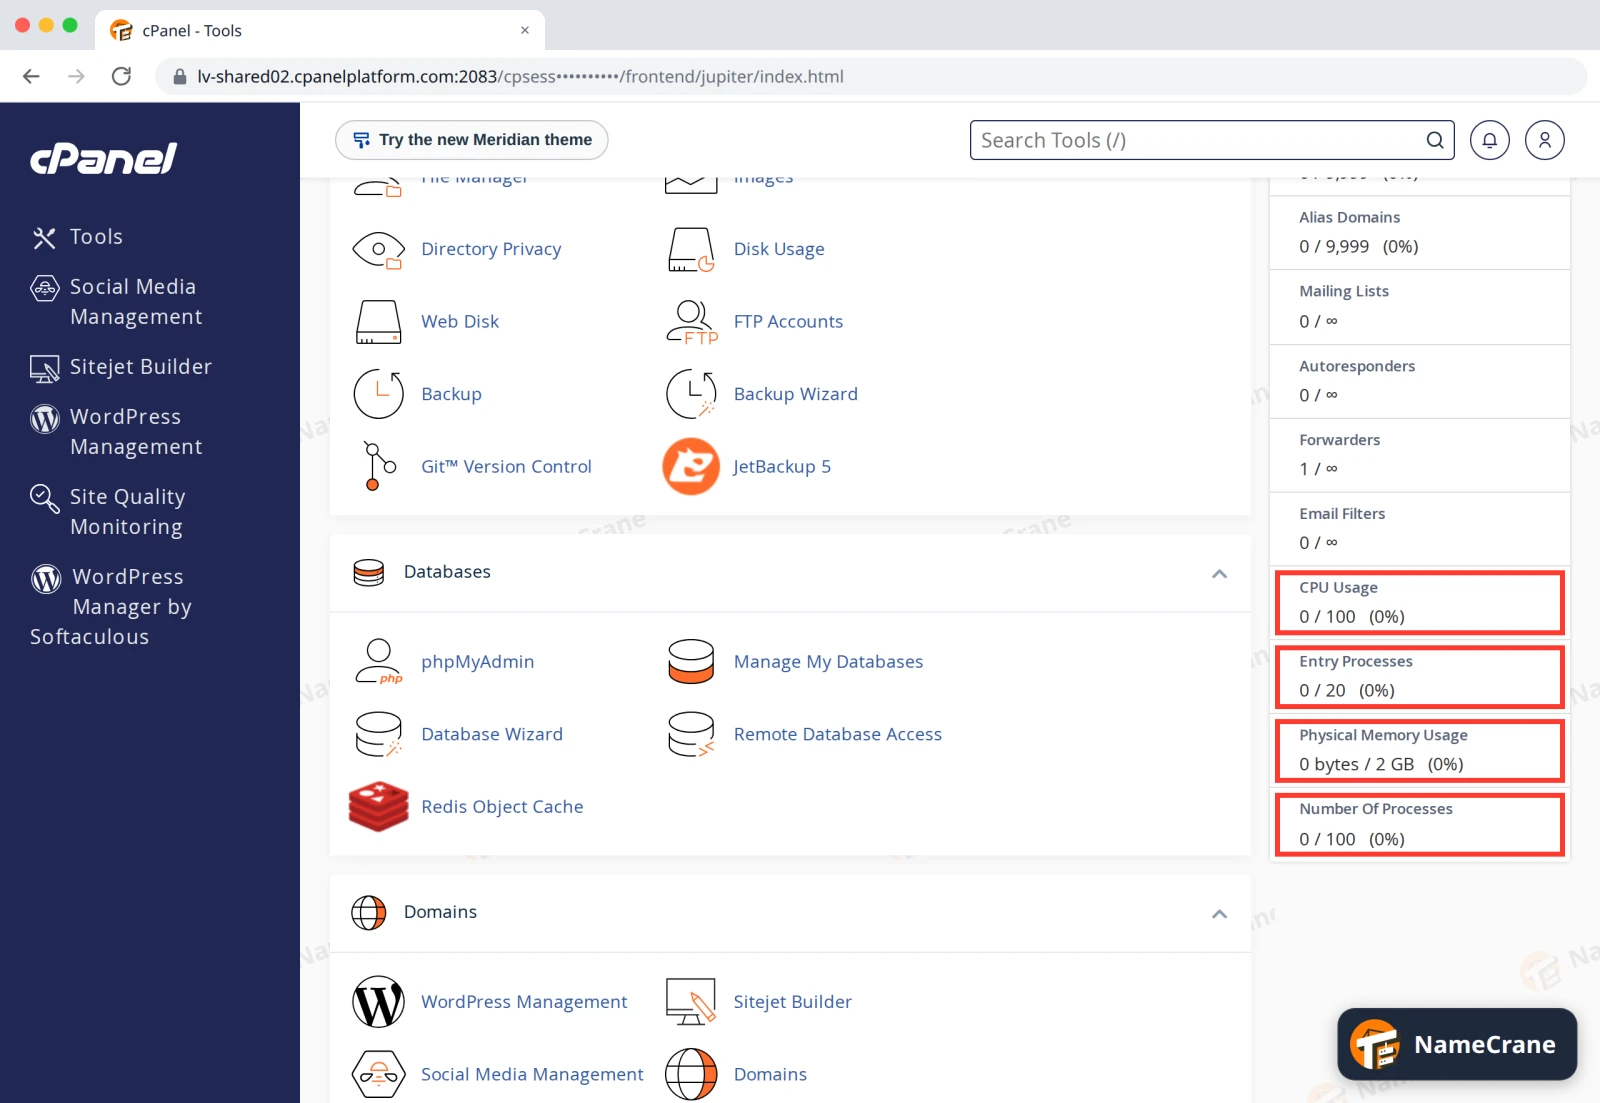
These figures are a snapshot of this moment. To see whether your site hit a limit earlier, open Resource Usage.
Open Resource Usage
-
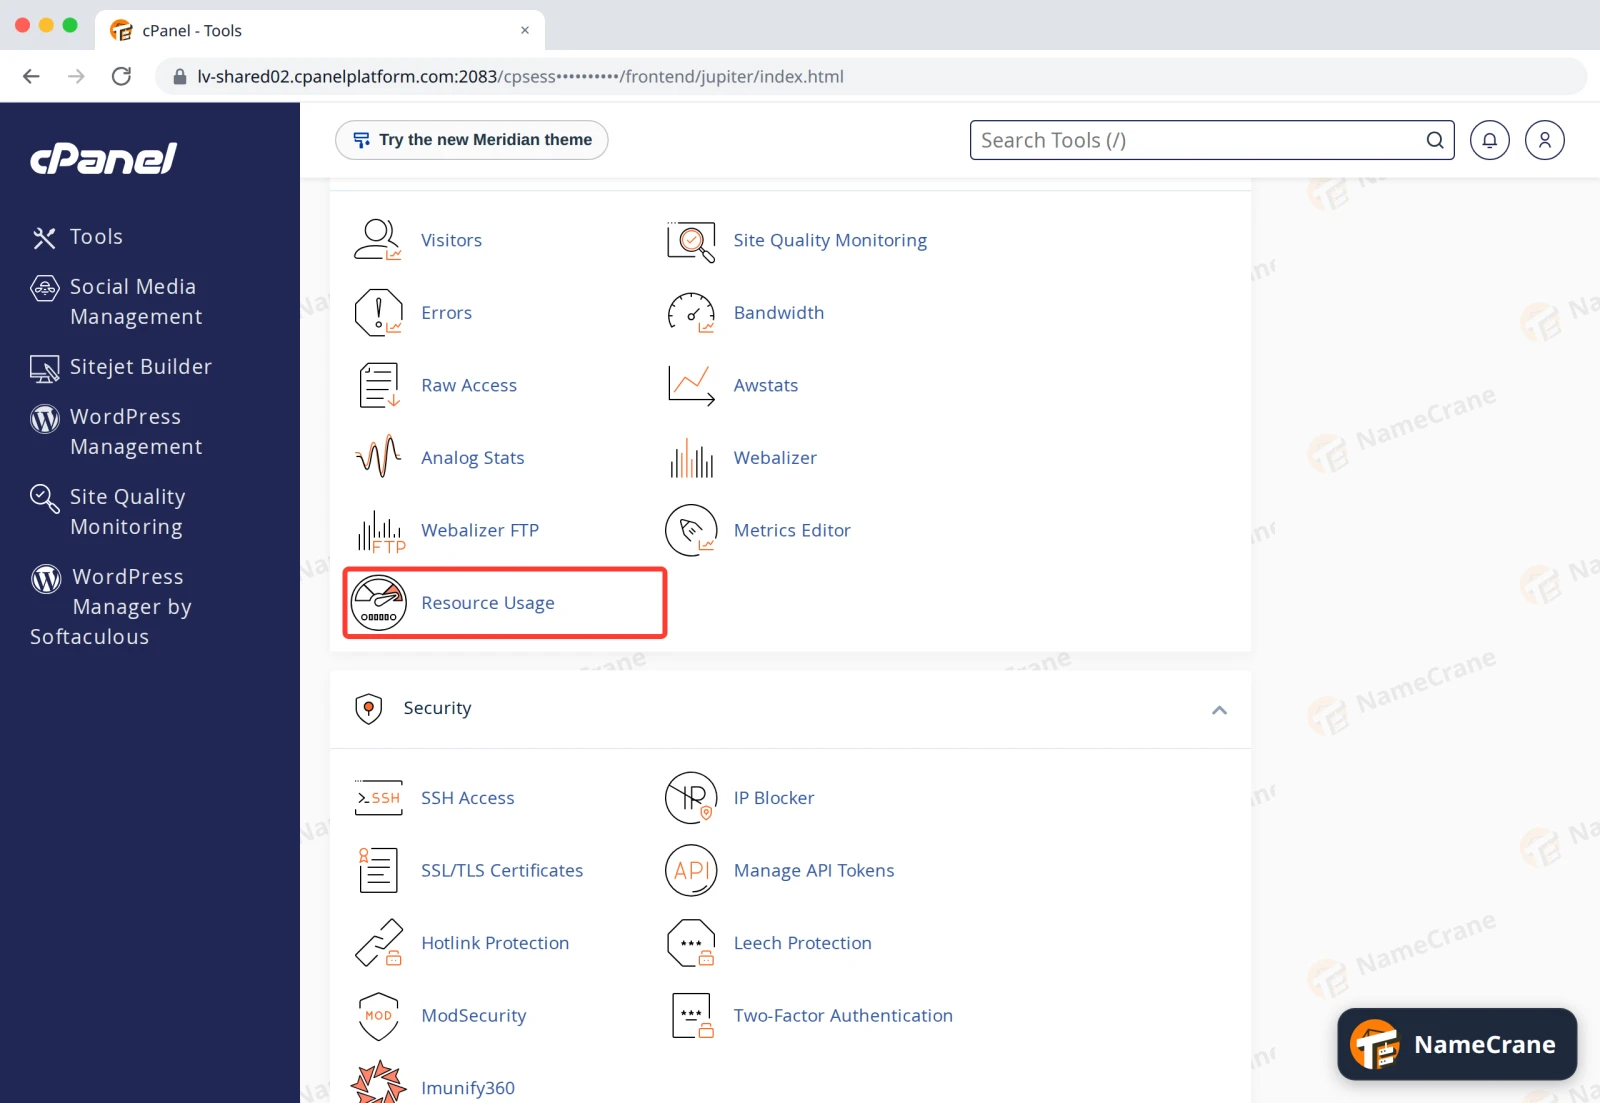
In the Metrics section, click Resource Usage.
-
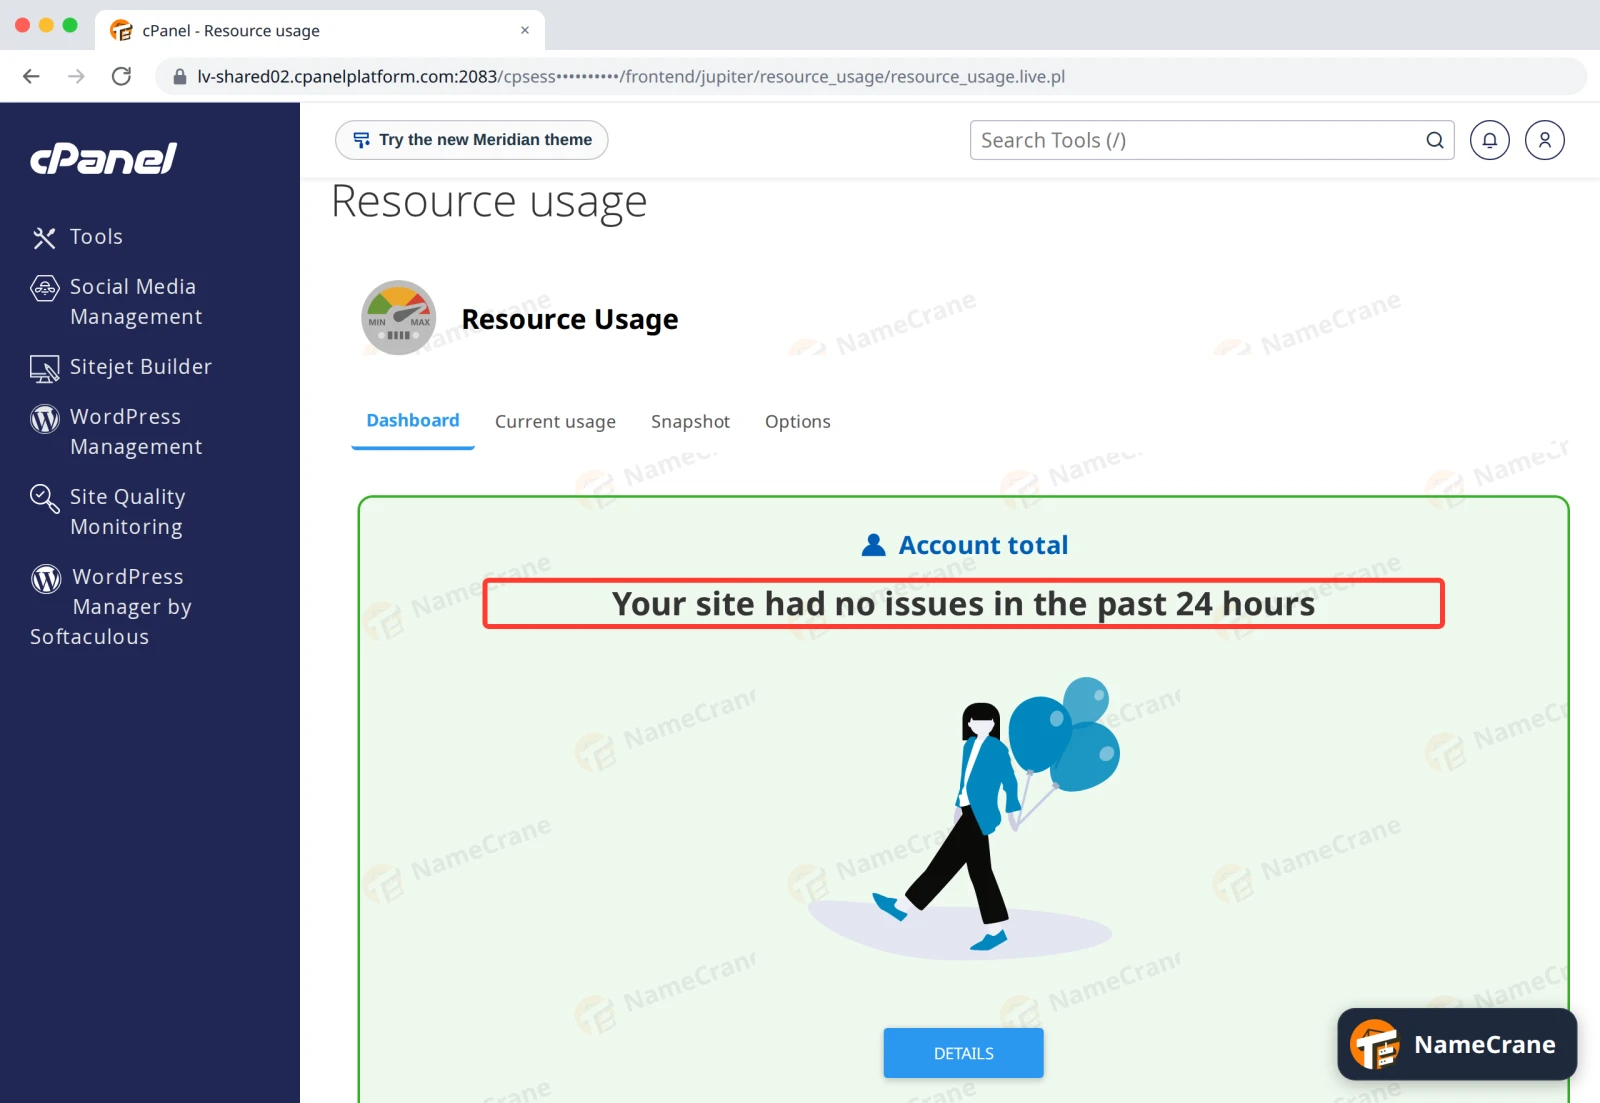
The Dashboard tells you straight away if your site hit a limit in the past 24 hours. Here, our site had no issues.
-
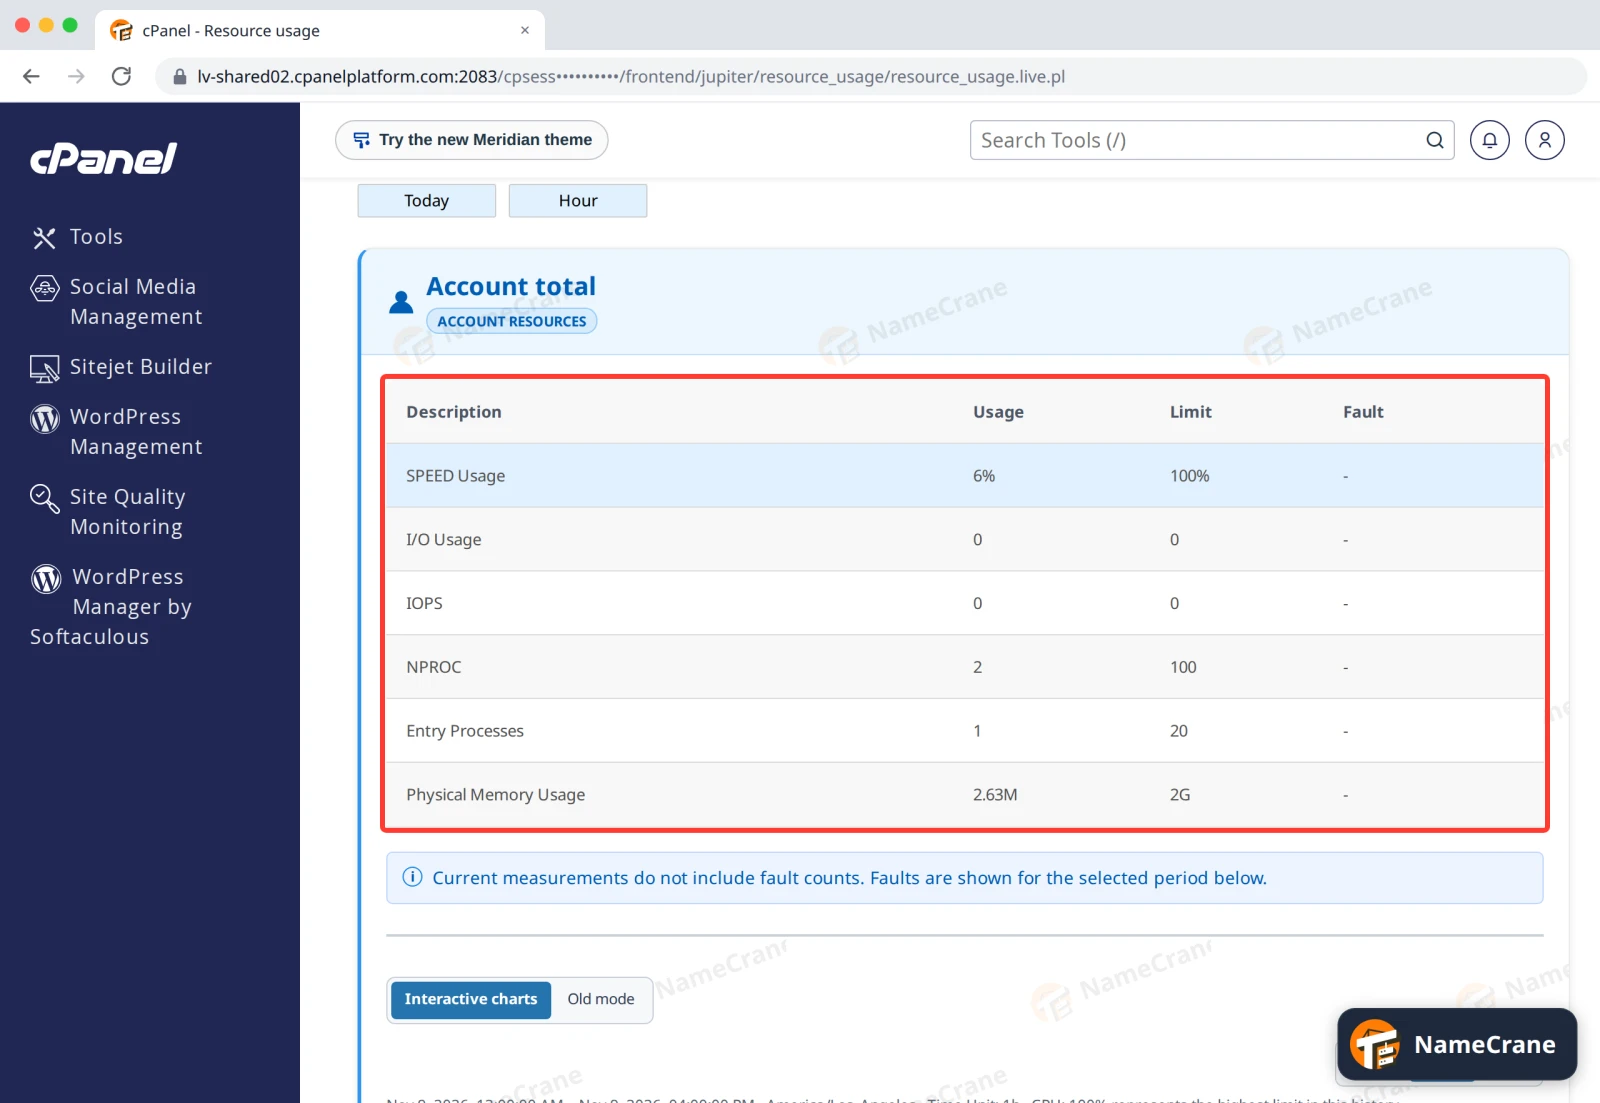
Click Current usage. The table shows what your site uses now (Usage) next to your plan’s Limit.
-
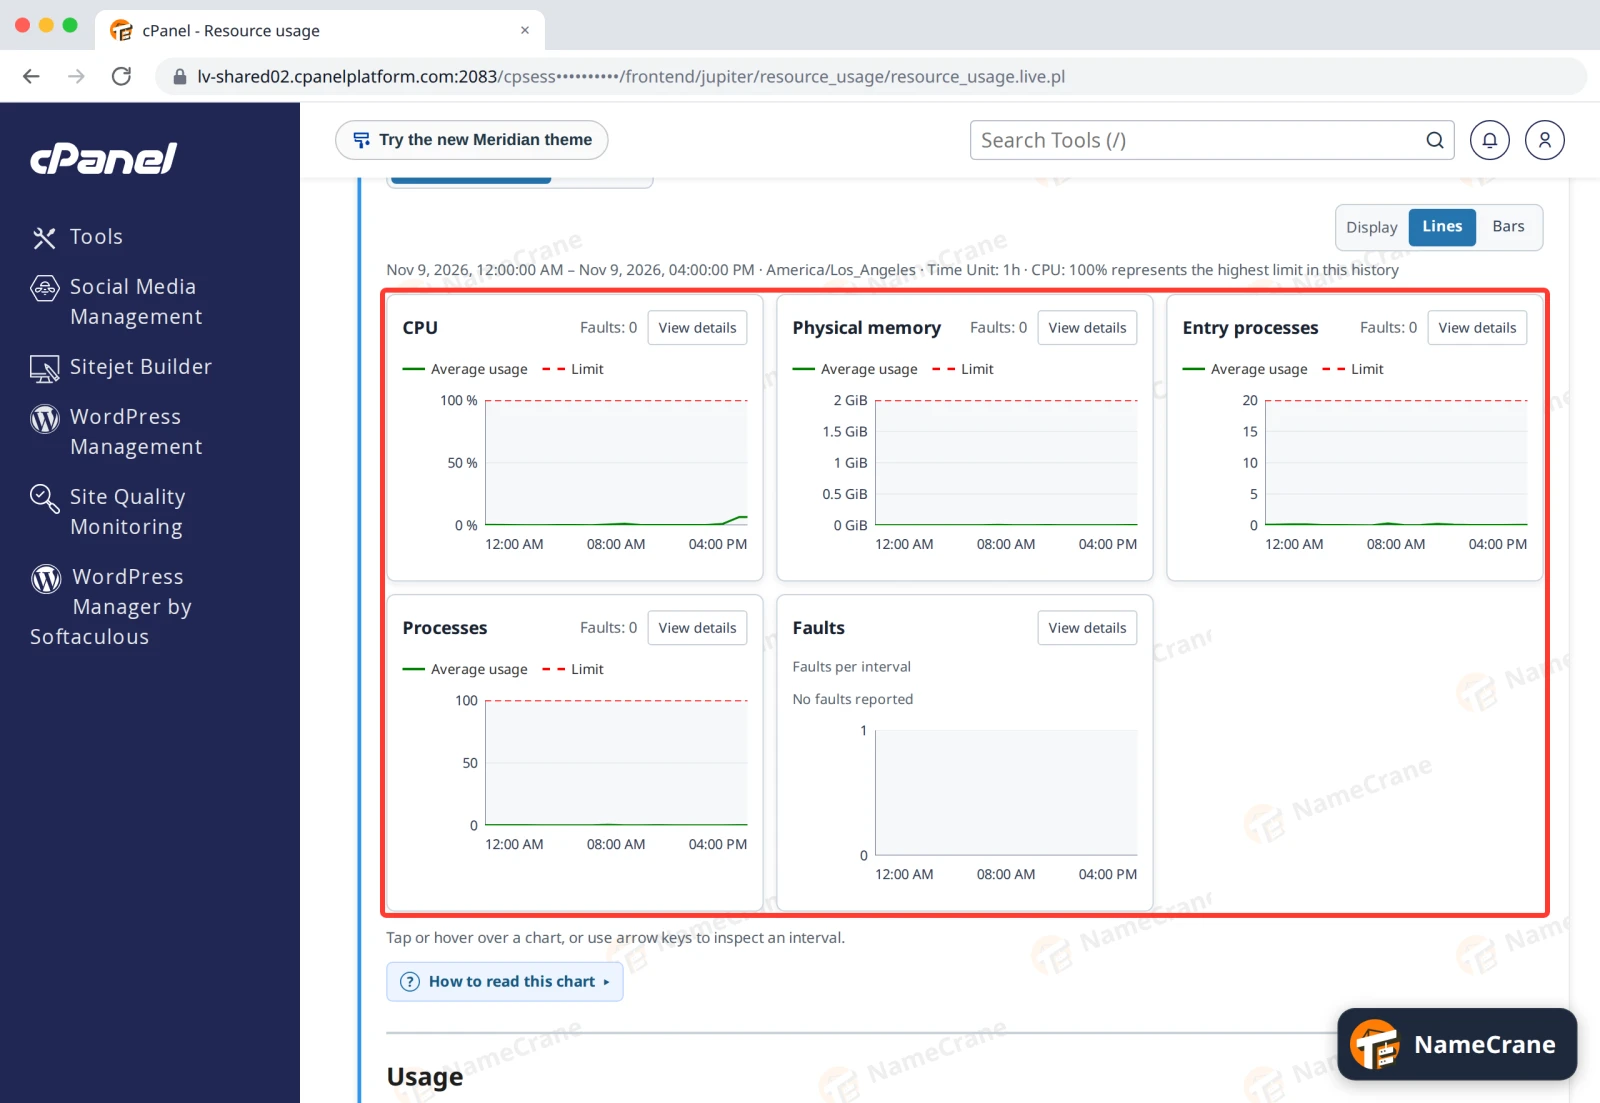
Scroll down for charts of today’s usage. The dashed line is your limit. Faults counts how many times your site hit a limit. Use Timeframe at the top to look further back.
What the figures mean
| Figure | What it is |
|---|---|
| SPEED (CPU) | Processing power. 100% is one full processor core. Hitting this limit slows your site down. |
| Physical Memory | The memory your site’s scripts use, such as PHP. |
| Entry Processes | How many requests to your site’s scripts, such as PHP pages, can run at the same moment. It’s not the number of visitors: each request only takes a moment. |
| NPROC (Number Of Processes) | All the processes your account runs at once, including email and cron jobs. |
| I/O and IOPS | How fast your site reads and writes to disk. A limit of 0 means there’s no limit. |
When your site hits the memory, entry process or process limit, visitors can see a 508 Resource Limit Is Reached error until usage drops again.
If your site keeps hitting a limit
- Turn on caching. On WordPress, a caching plugin such as LiteSpeed Cache serves ready-made pages without running PHP each time. Redis Object Cache helps too.
- Look for bots. A burst of visits from one address, or to one file such as
xmlrpc.php, often causes it. Check Visitors and block the address if needed. - Check your cron jobs. Jobs that run every minute add up. See Cron jobs.
- Upgrade. If your site has simply grown, contact support to move to a bigger plan.
Troubleshooting
| Problem | What to do |
|---|---|
| Visitors see 508 Resource Limit Is Reached | Your site hit a limit. Open Resource Usage to see which one, then follow the tips above. |
| Current usage says “Current usage is unavailable” | Reload the page and click Current usage again. In our test it worked on the second try. |
| The figures on the home page are all 0 | That’s normal for a quiet site: they show this exact moment. Use Resource Usage to see the day’s usage. |
Snagged on something? Contact support and we’ll get you sorted.