How to See Your Website's Visitors, Errors and Stats in cPanel
Last updated Changelog
On this page
cPanel’s Metrics section shows who visits your website and what goes wrong on it. These three tools cover most needs:
| To see this | Use |
|---|---|
| The latest visits: IP address, page, time and browser | Visitors |
| Problems such as missing files or blocked pages | Errors |
| Monthly totals: visitors, popular pages, browsers and more | Awstats |
See your latest visitors
-
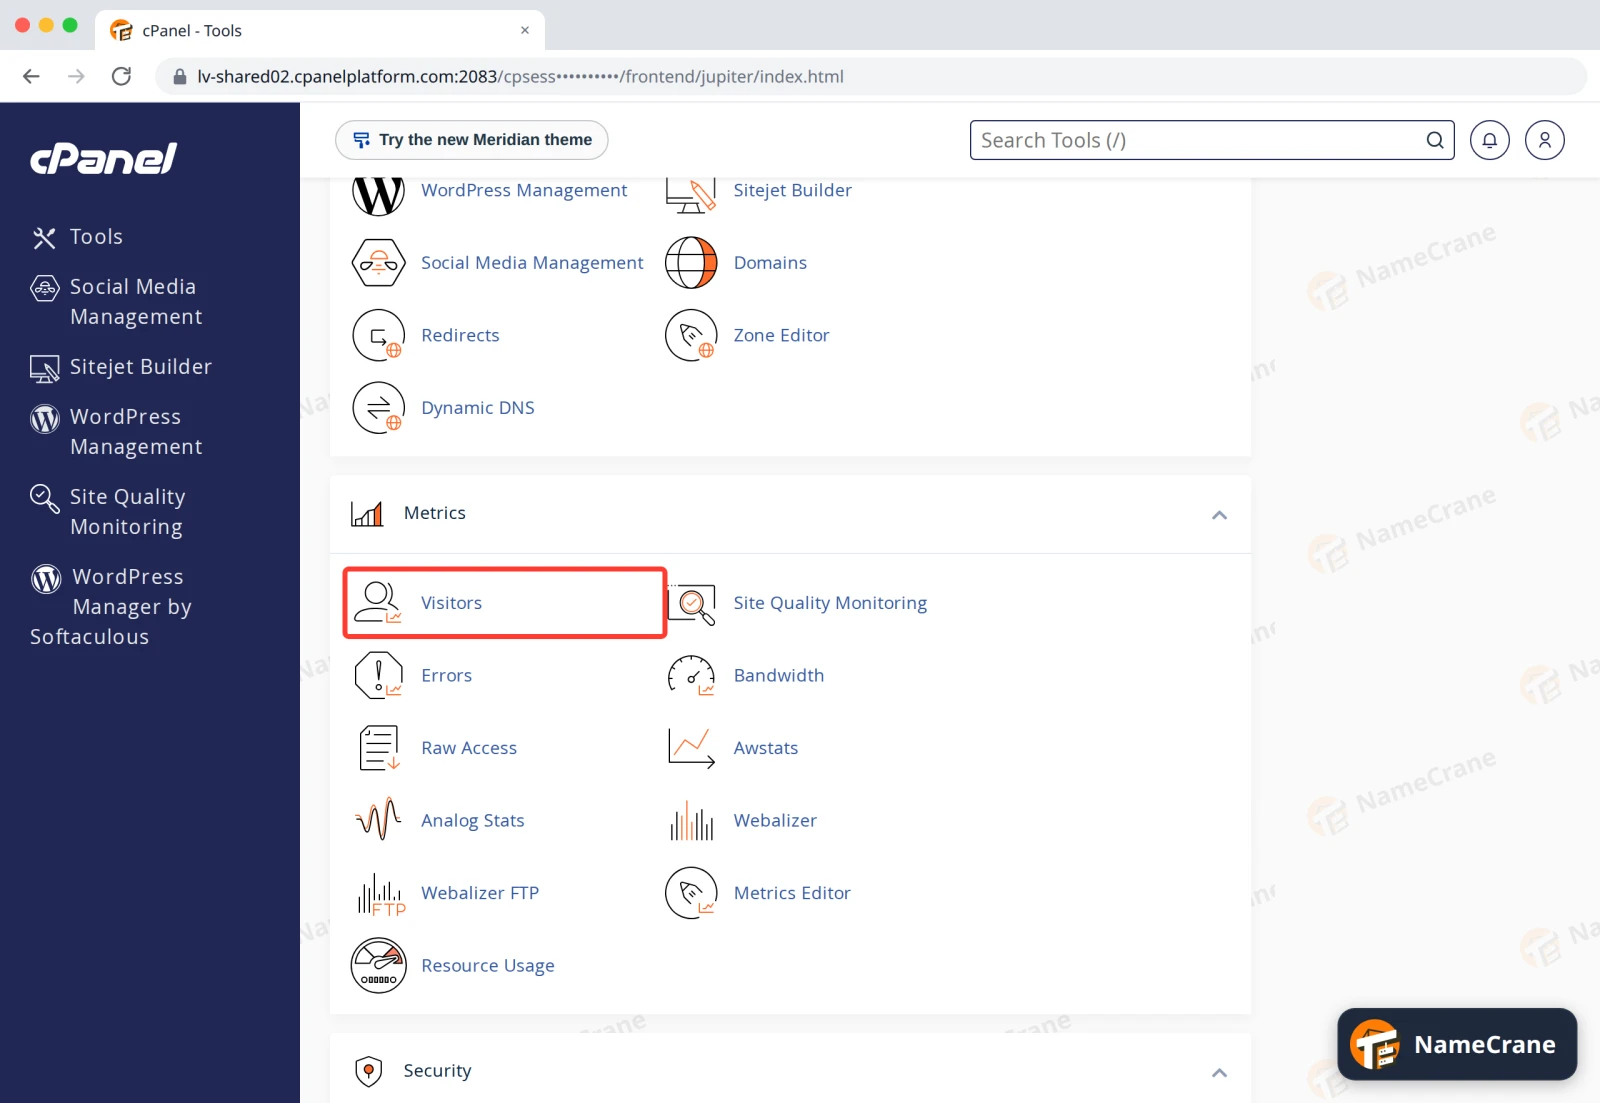
Log in to cPanel and click Visitors in the Metrics section.
-
Click the magnifying glass next to your domain. Each domain is listed twice: the one marked (SSL) shows visits to
https://, which is most of them.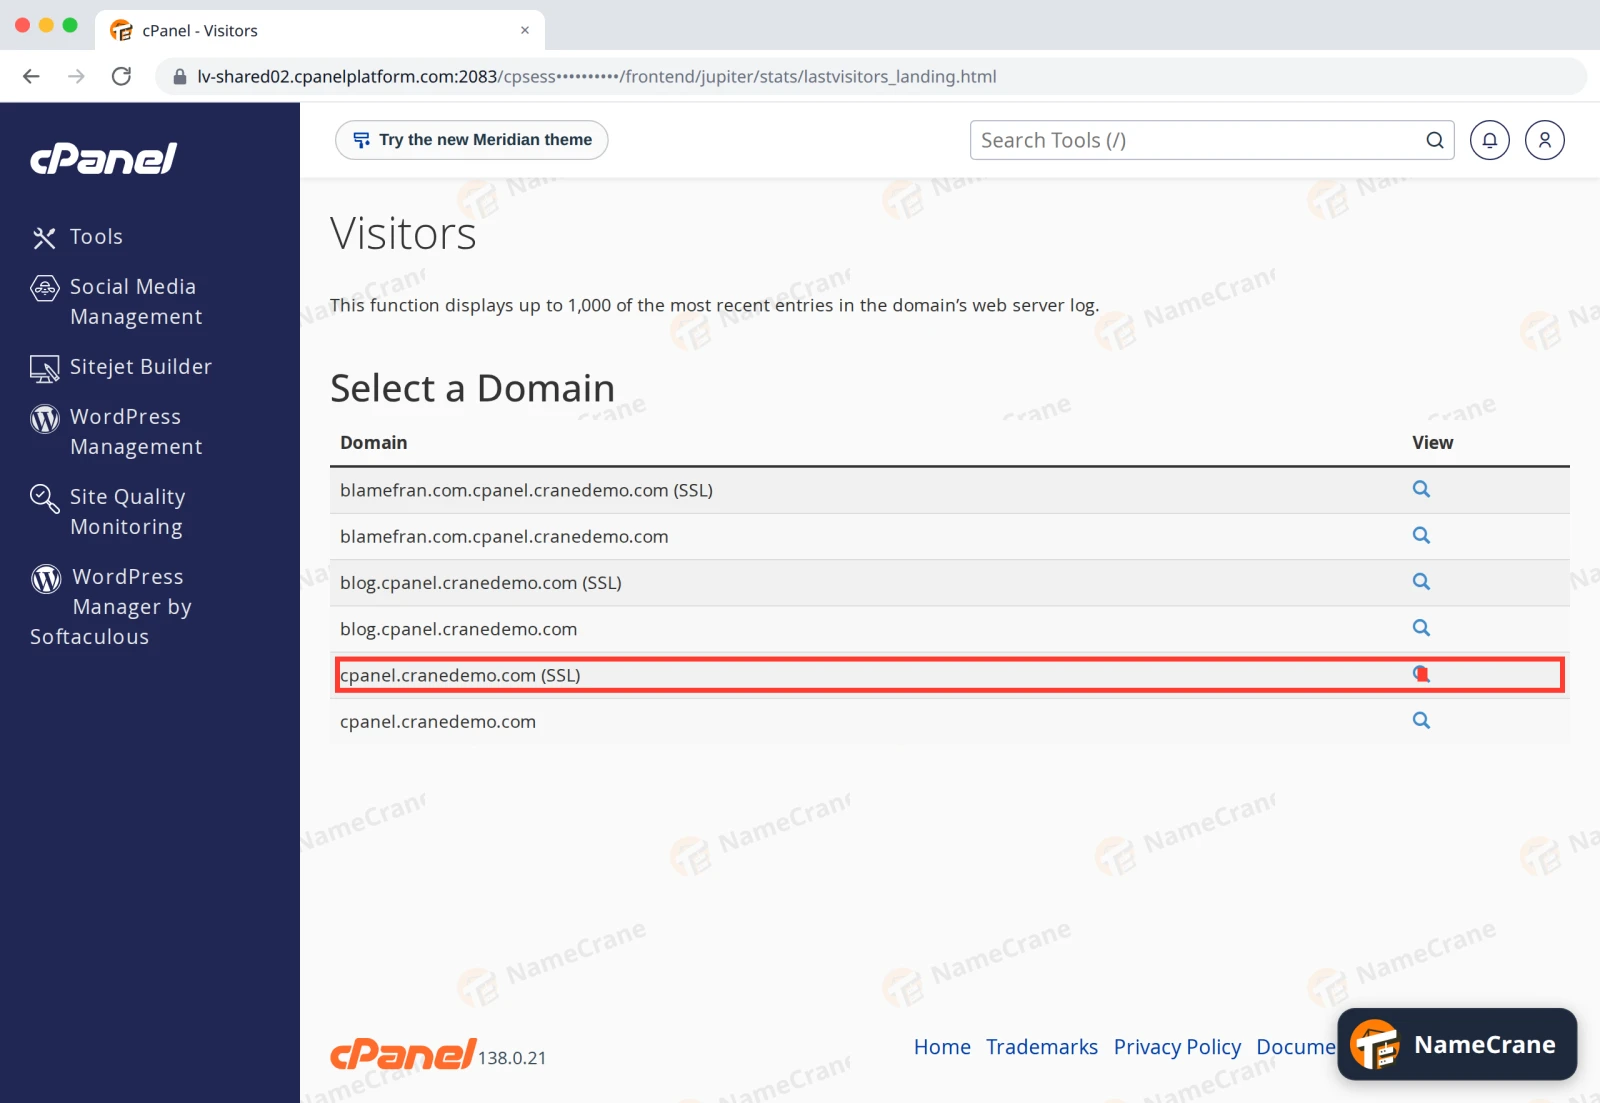
Note: Domains you’ve added appear with your main domain on the end, such as
blamefran.com.cpanel.cranedemo.com. -
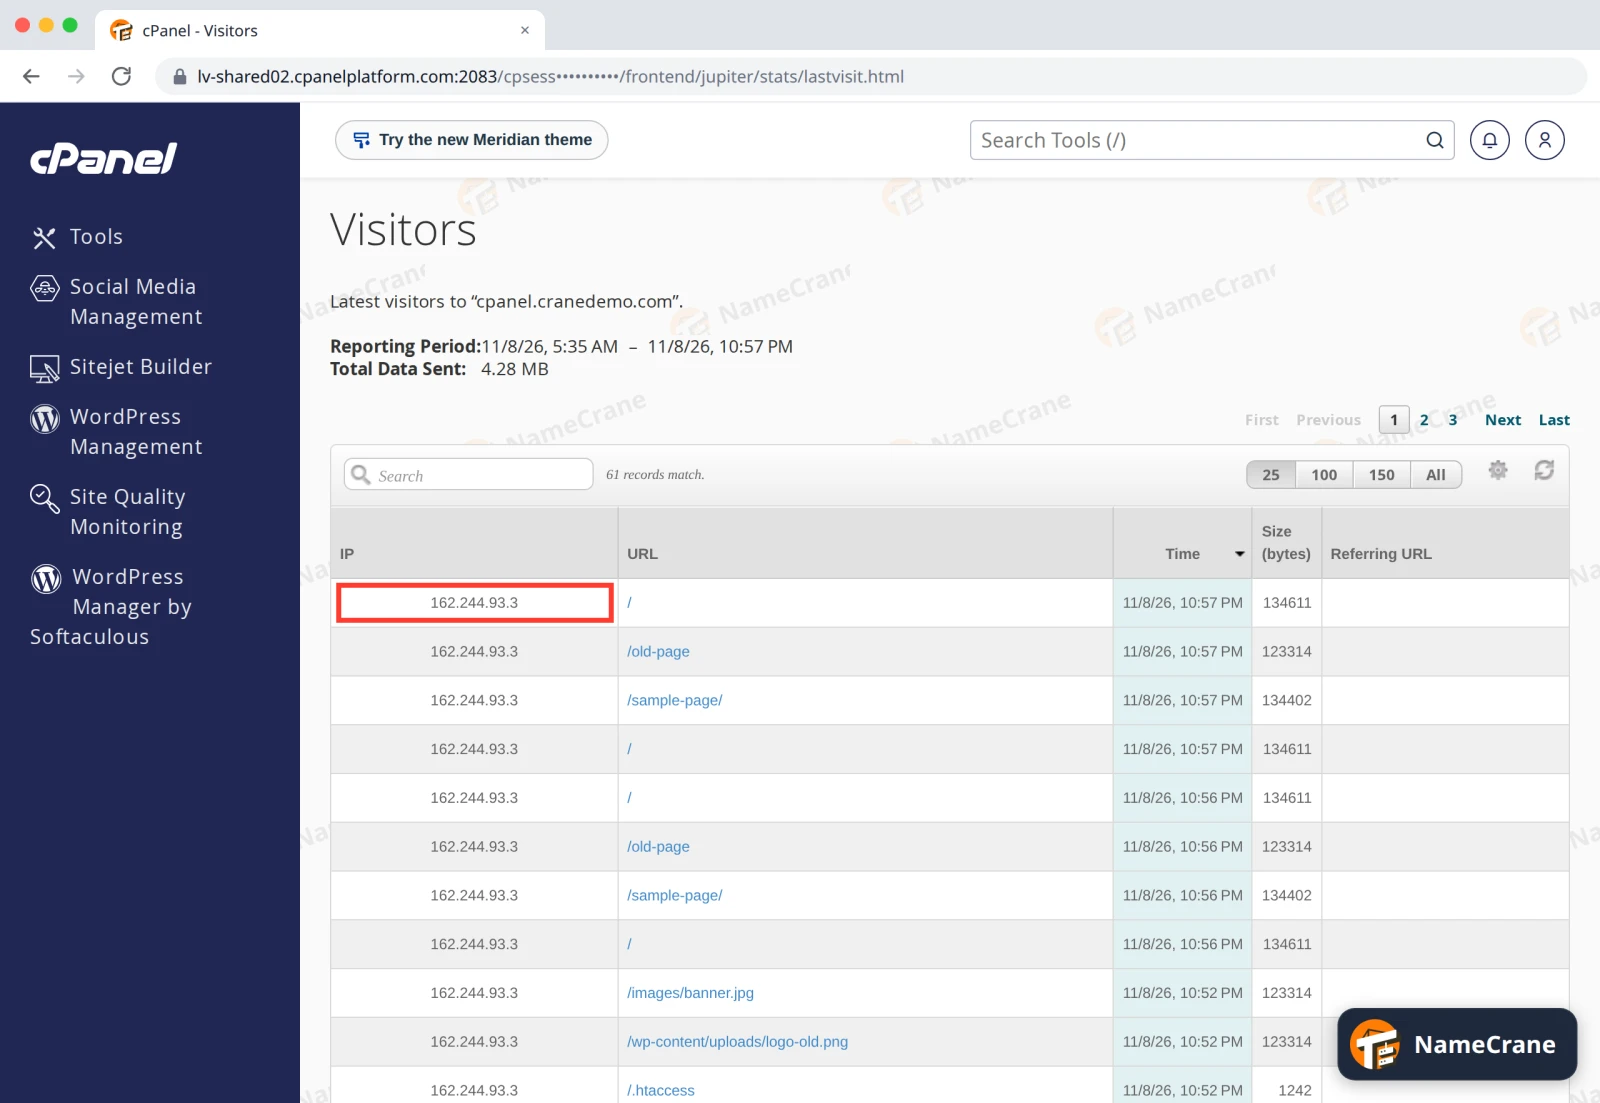
You’ll see up to 1,000 of the most recent visits, newest first. IP is the visitor’s address, URL is the page they opened, and User Agent (scroll right) shows their browser. Type in Search to filter the list, for example by IP address or page.
Tip: Found an address that’s causing trouble? See Block an IP address.
Find errors
-
In the Metrics section, click Errors.
-
The box shows the newest entries in your web server’s error log, for all your websites. File not found means something links to a file that isn’t there, and the message shows which file. Here, a visitor asked for
/images/banner.jpgonblog.cpanel.cranedemo.com.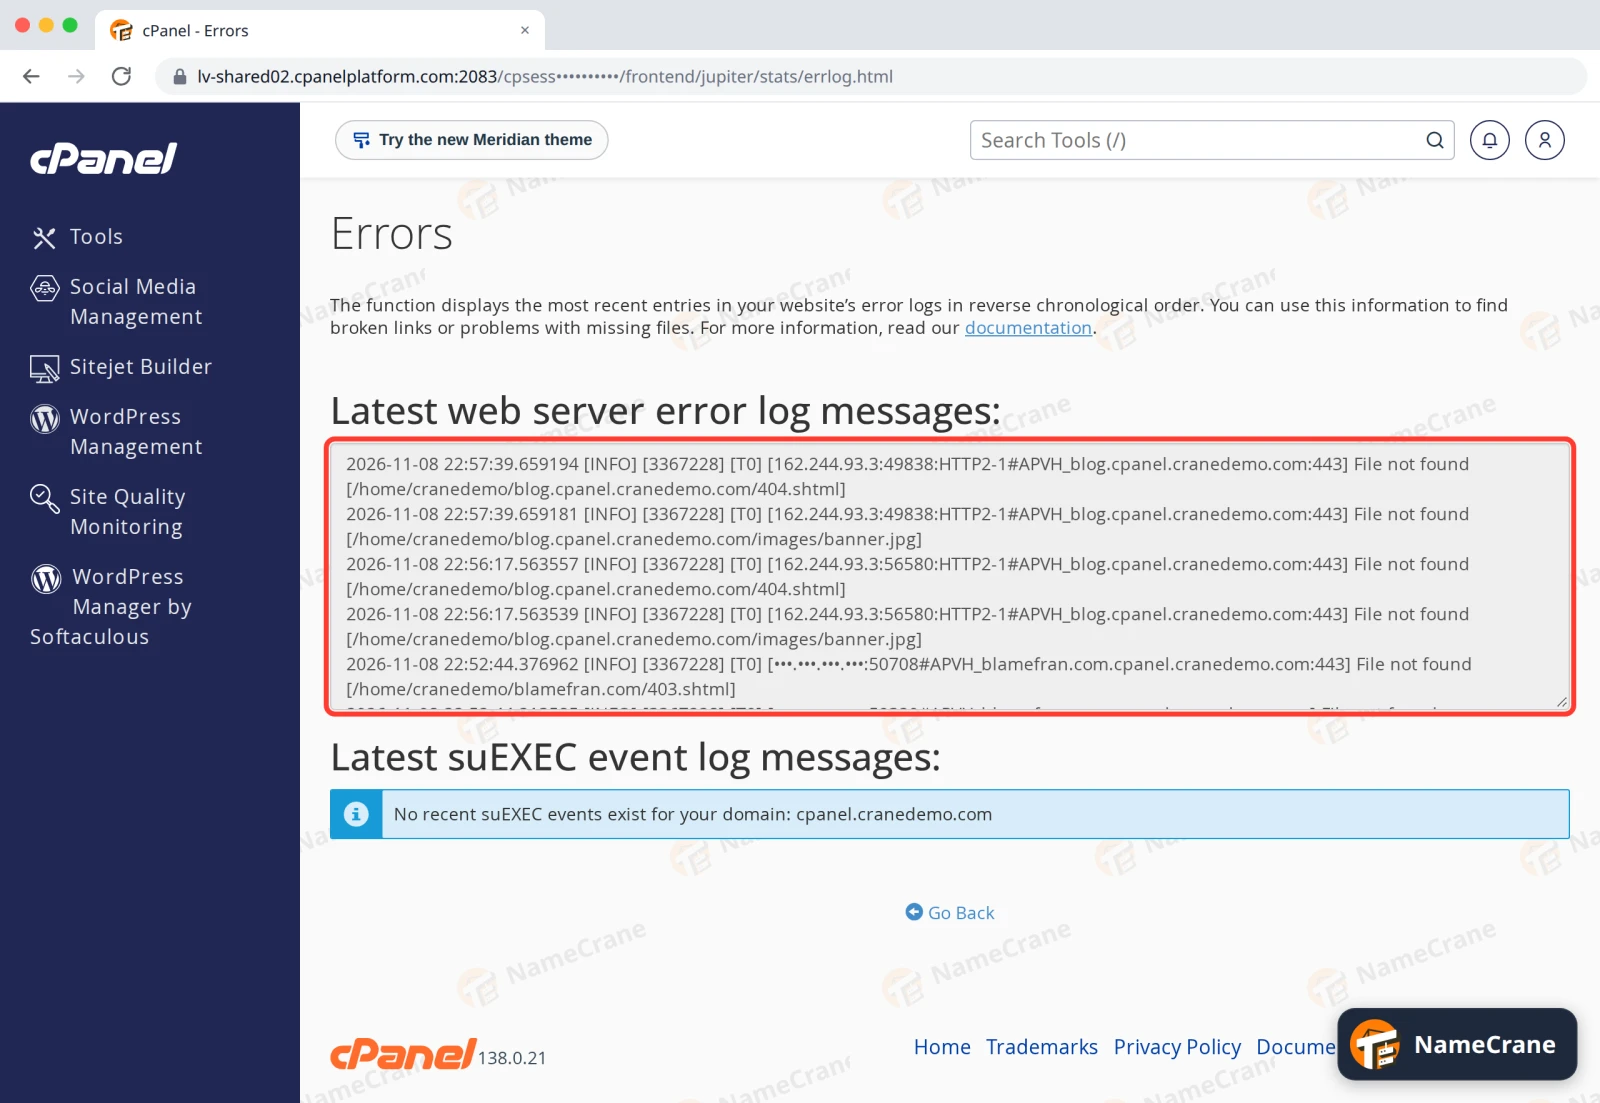
Two kinds of problems don’t show up here:
- Missing pages on a WordPress site. WordPress handles those itself and shows its own “Page not found” page.
- PHP errors. cPanel writes those to
logs/php.error.login your home folder. Open it in File Manager.
Read your monthly stats
-
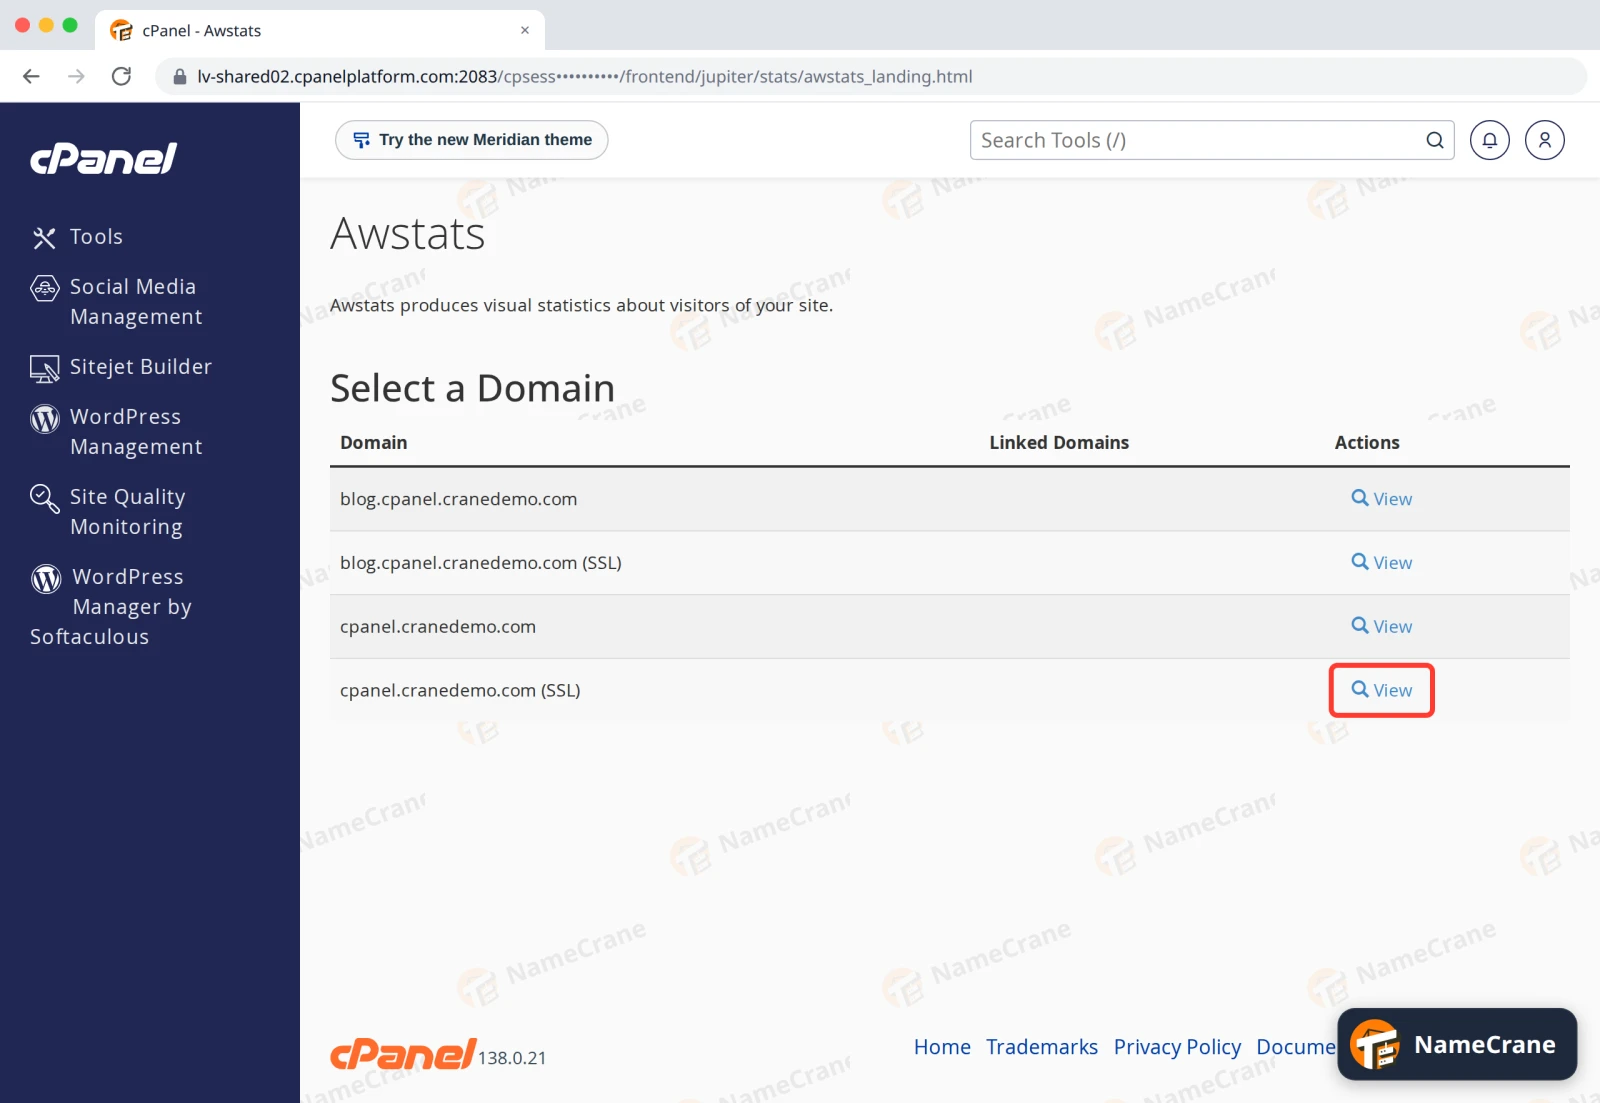
In the Metrics section, click Awstats. Then click View next to your domain. The report opens in a new tab.
-
Summary shows this month’s unique visitors, visits, pages and data used. The menu on the left jumps to more detail, such as countries, popular pages and browsers.
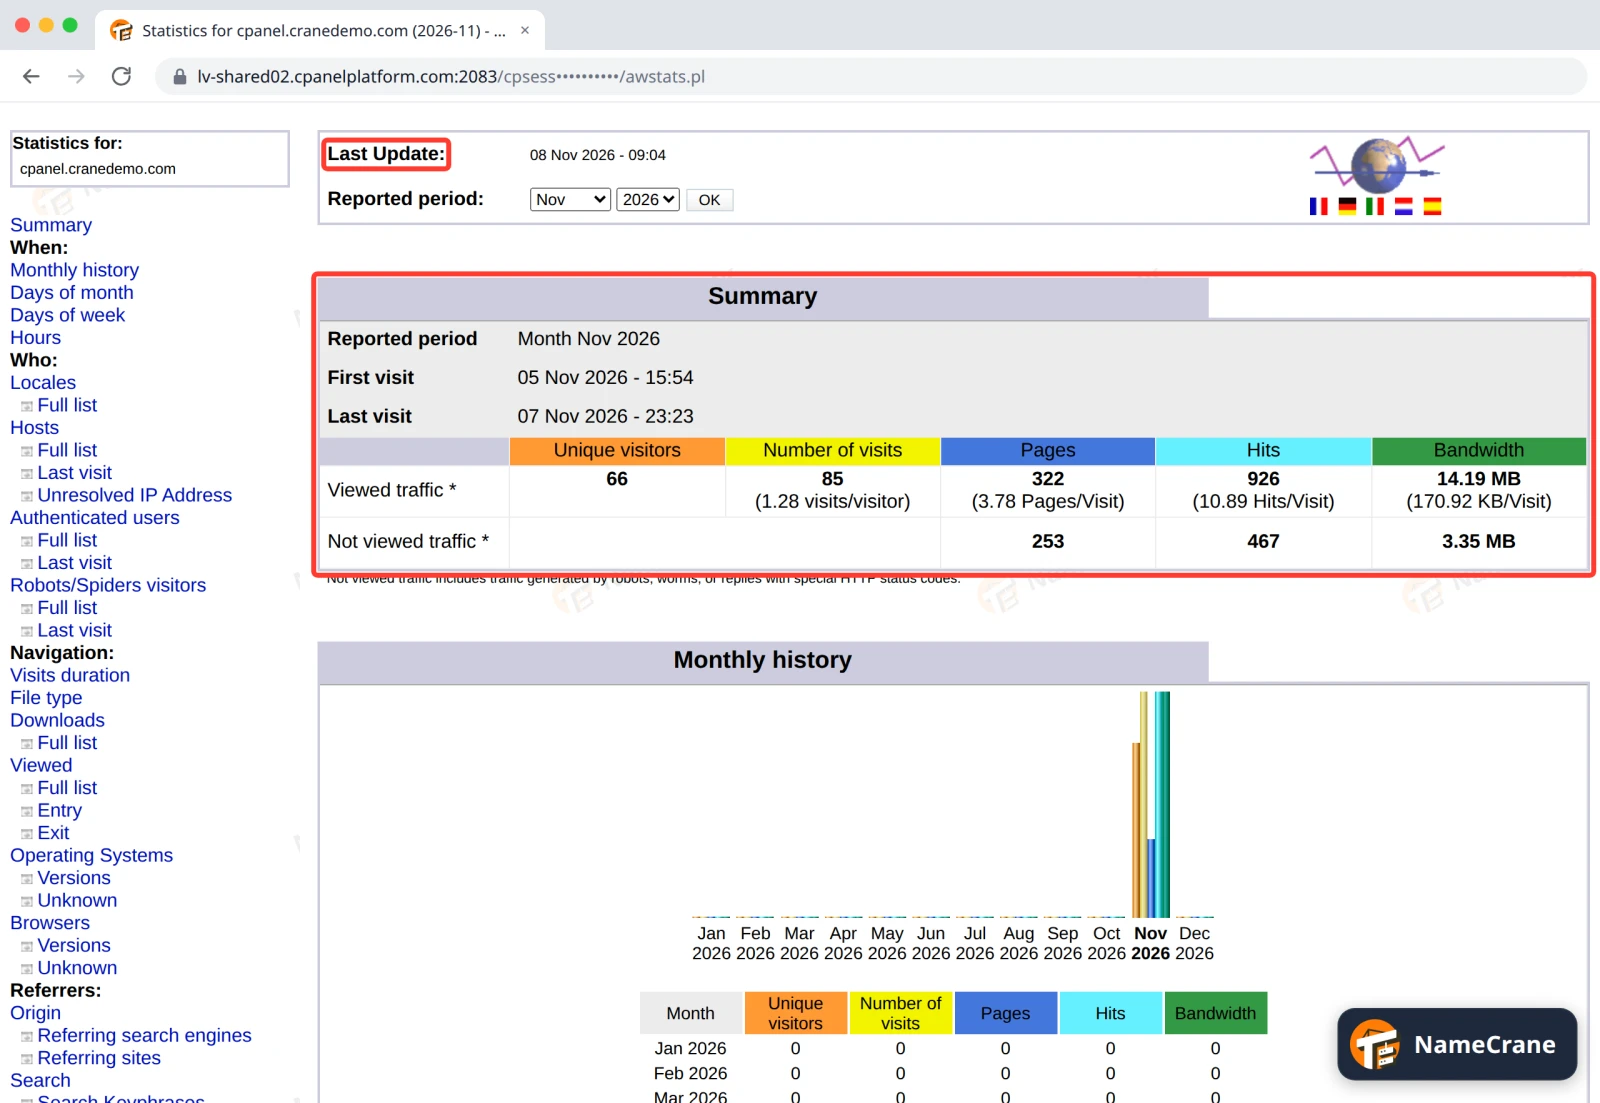
Awstats isn’t live. Last Update at the top shows when it last counted your visits: in our test, it updated once a day. Not viewed traffic is mostly robots and search engines.
Other Metrics tools
| Tool | What it shows |
|---|---|
| Bandwidth | How much data each of your domains has used |
| Raw Access | Download your full visitor logs, for your own records or another stats program |
| Resource Usage | Whether your account has hit its CPU or memory limits |
| Webalizer and Analog Stats | Other monthly stats reports, much like Awstats |
Troubleshooting
| Problem | What to do |
|---|---|
| Awstats shows nothing, or old numbers | It updates once a day. Check Last Update at the top, and look again tomorrow. A brand-new domain appears after its first update. |
| I can’t find my domain in Visitors | Domains you’ve added are listed with your main domain on the end. Look for the (SSL) entry too. |
| The Errors box is empty, but my site shows an error | If the site runs WordPress or another app, the problem may be in PHP: look in logs/php.error.log. See Fix common website errors. |
| I see my own visits in the list | That’s normal. Search for your IP address to pick out your own visits. |
Snagged on something? Contact support and we’ll get you sorted.