Getting Started
Last updated Changelog
On this page
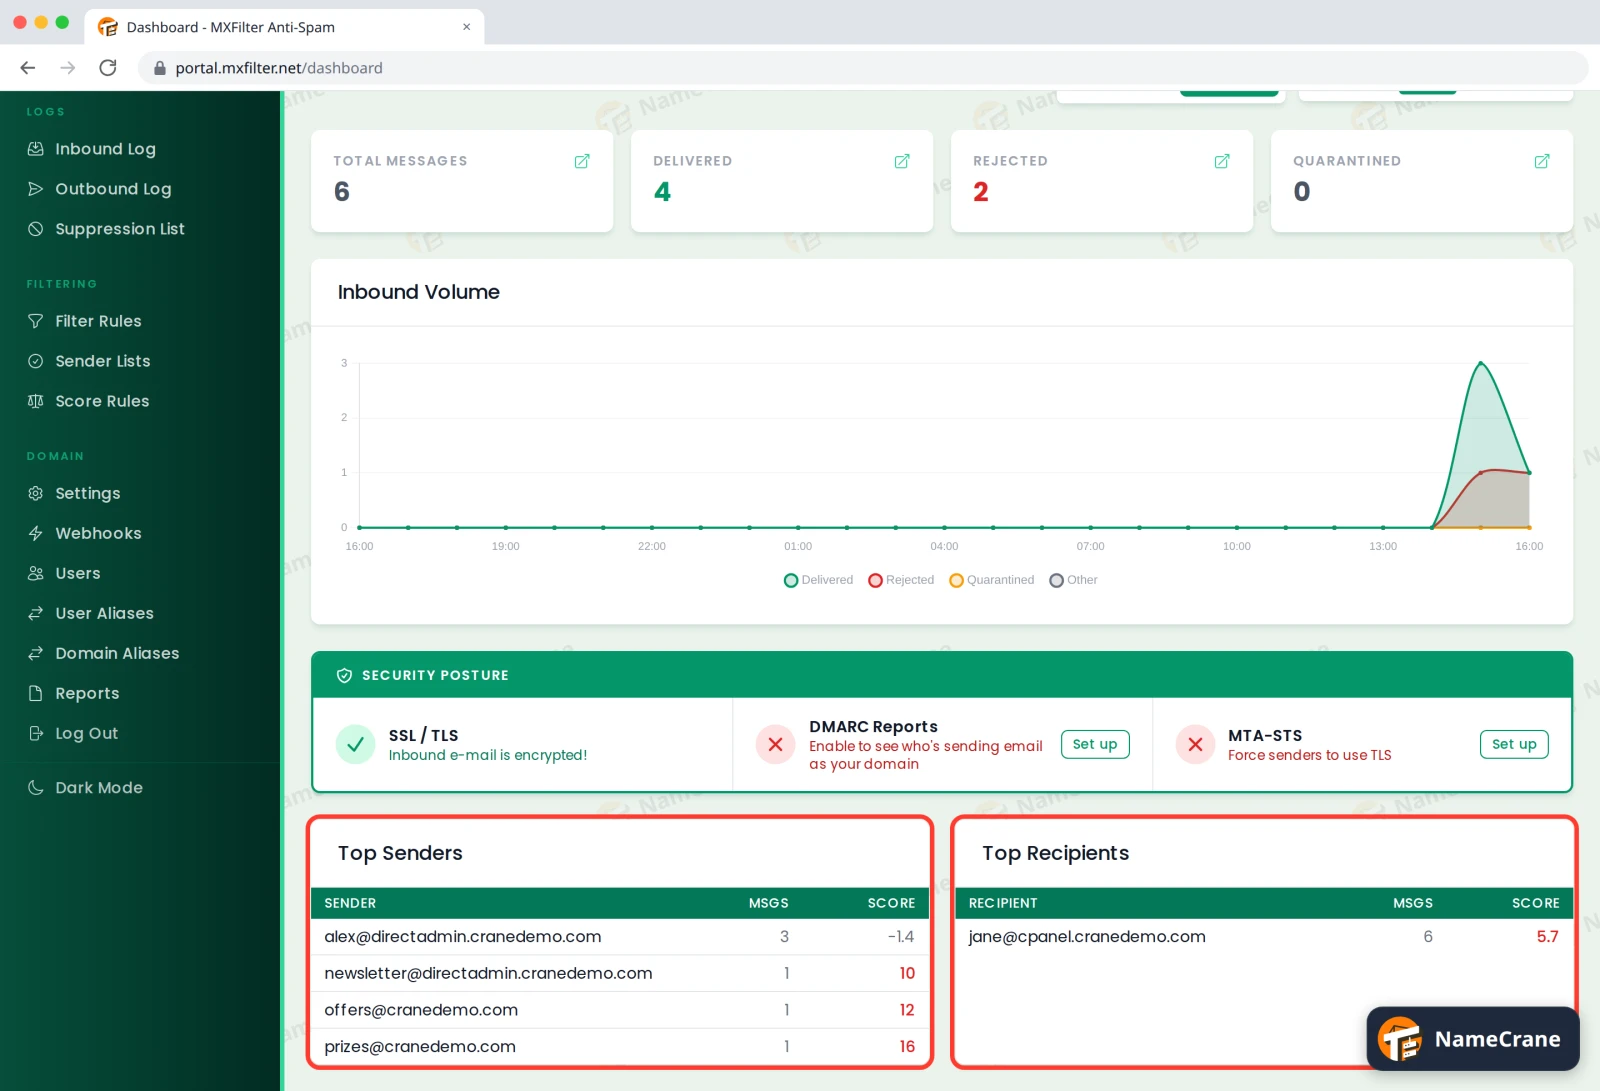
The dashboard is the first thing you see when you open MXFilter. It shows how much email your domain is receiving (or sending), what happened to it, and whether your domain’s email security is set up well.
Before you start
- Open MXFilter from your control panel: from cPanel or from DirectAdmin.
What’s on the dashboard
-
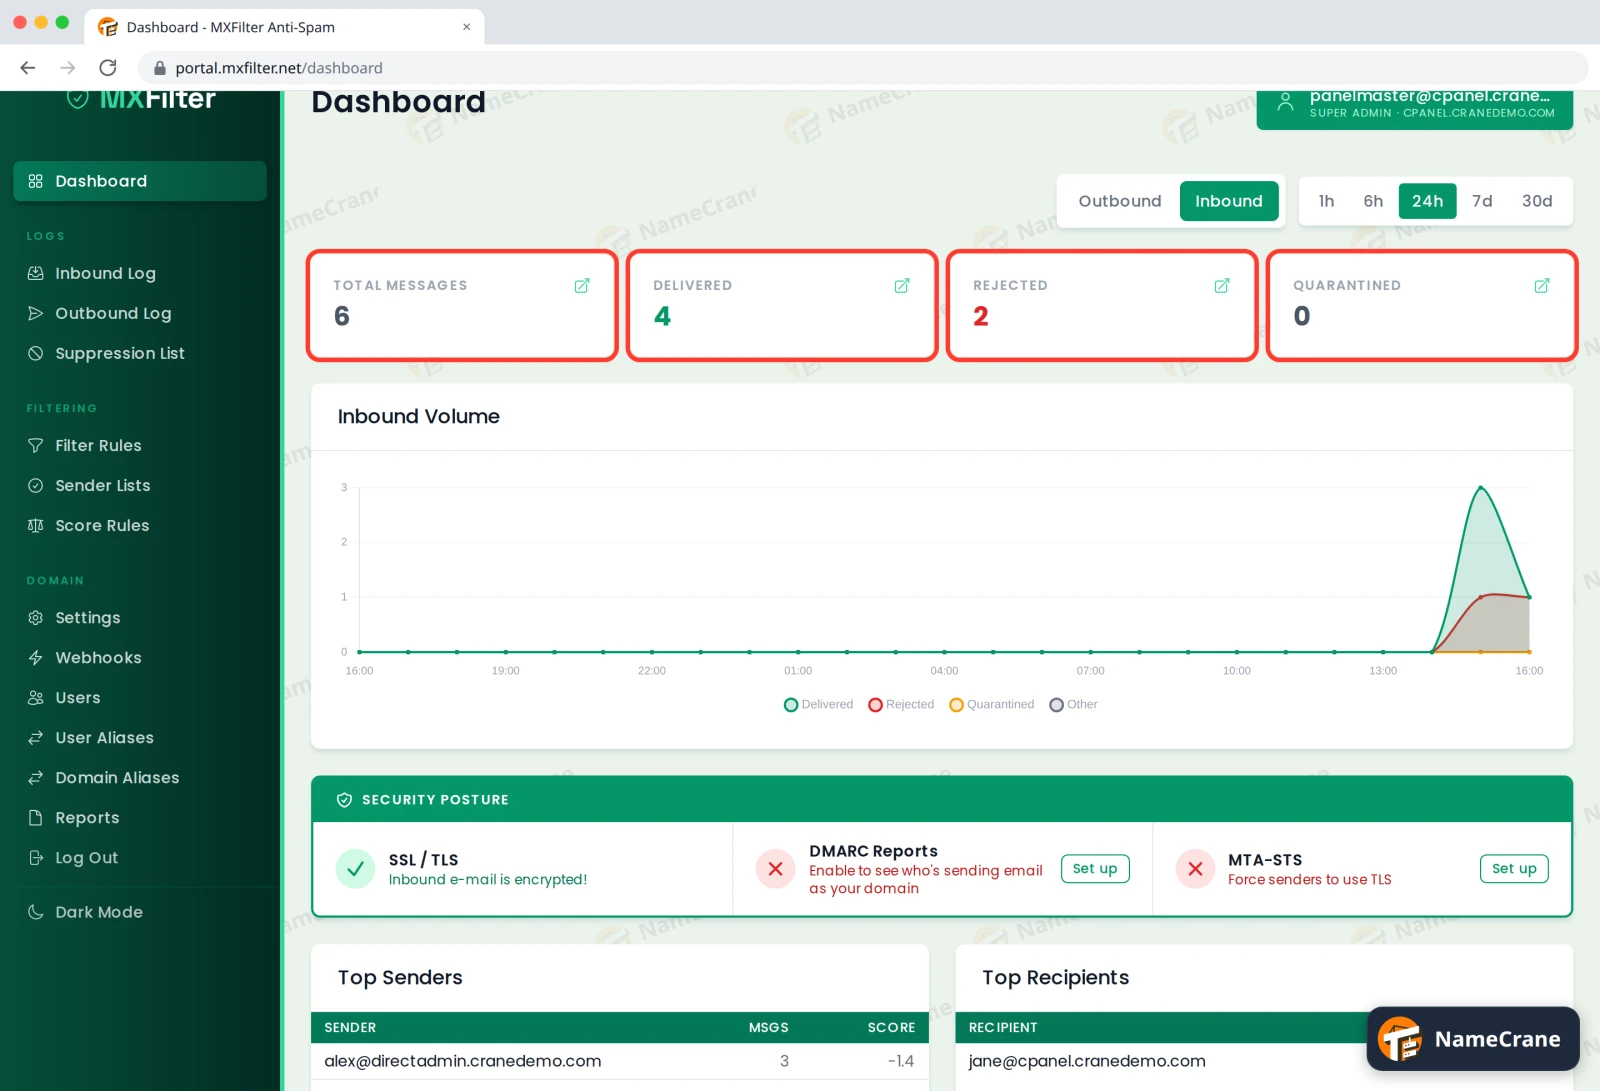
Message totals. Total Messages, Delivered, Rejected and Quarantined for the selected period. To see the messages behind a number, open the Inbound Log and filter by that status.
-
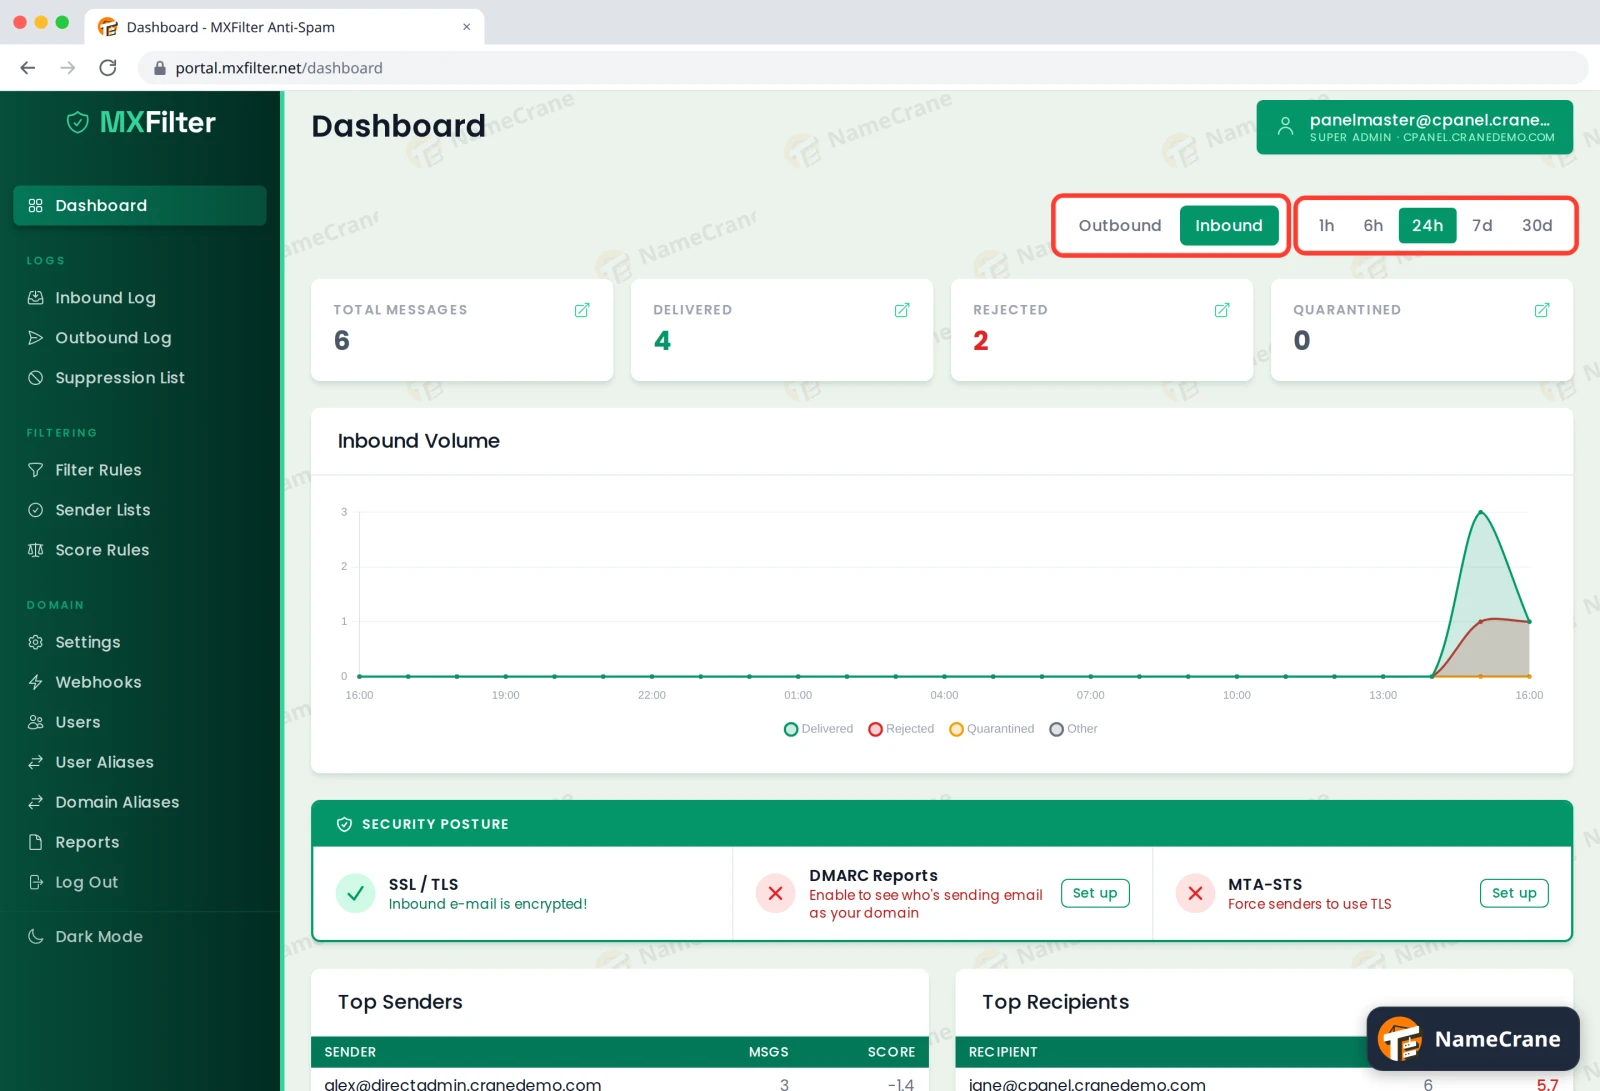
Direction and time range. Switch between Inbound (email you receive) and Outbound (email you send), and choose the last 1h, 6h, 24h, 7d or 30d.
-
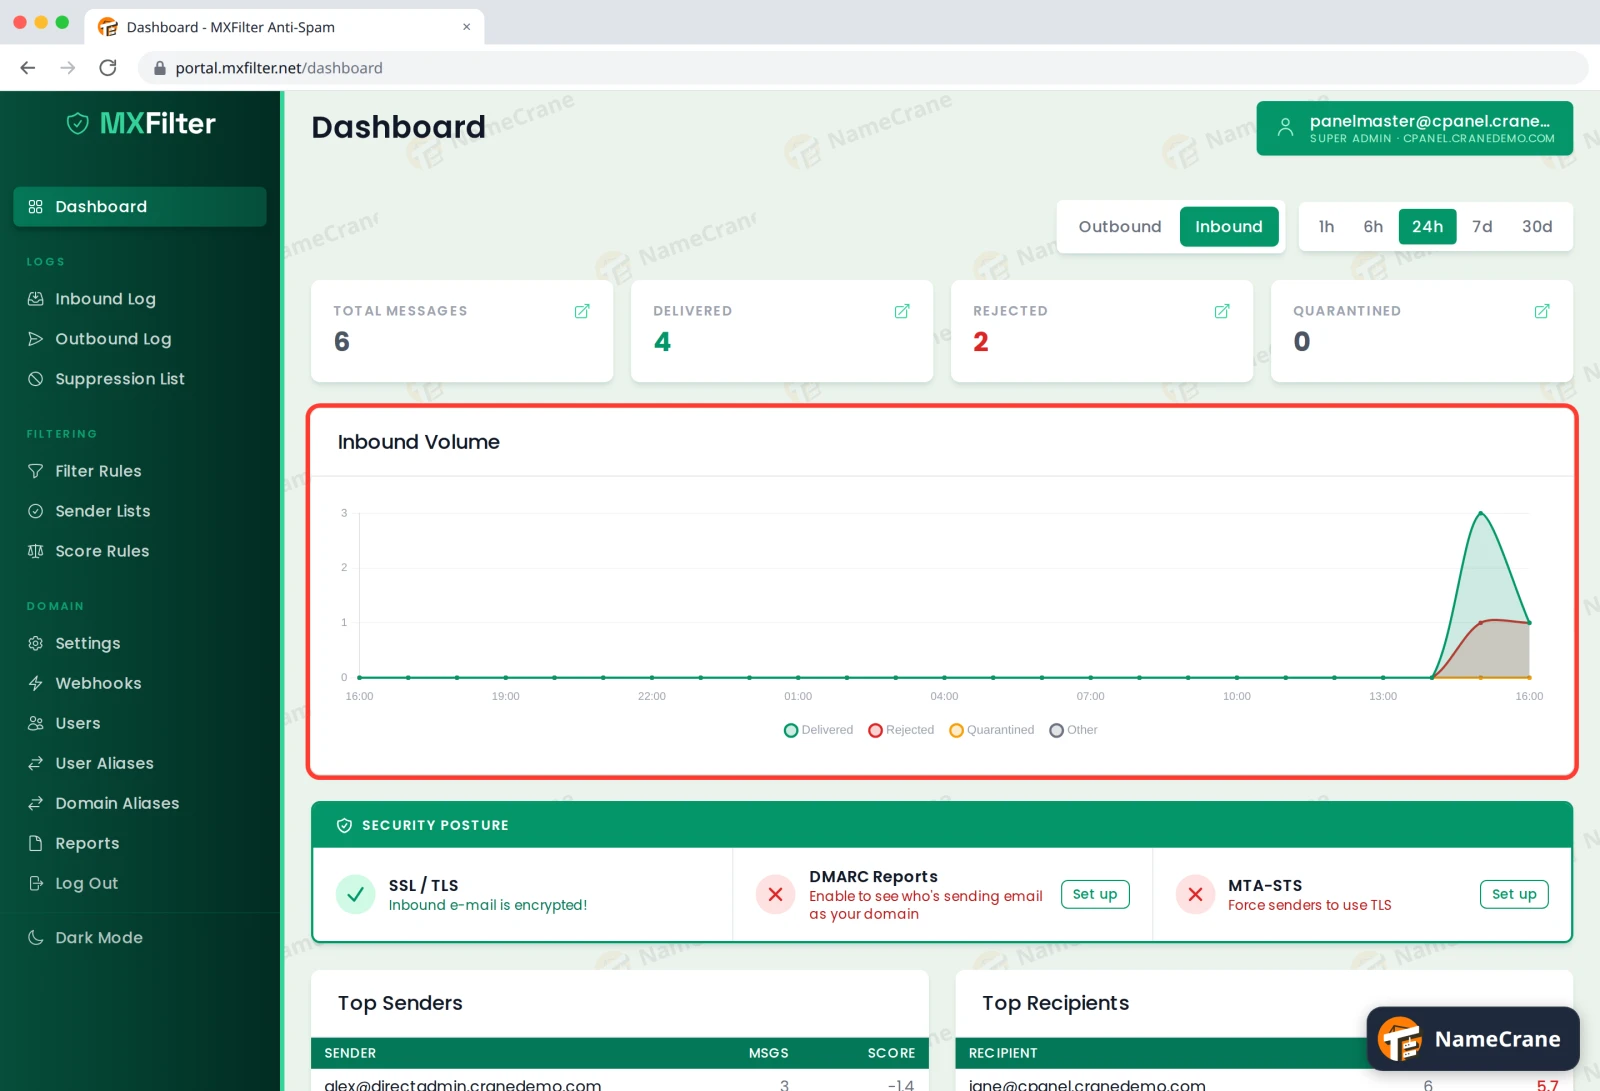
Volume chart. How many messages arrived over the period, split into delivered, rejected, quarantined and other. A sudden spike in rejected mail usually means a spam run aimed at your domain, which MXFilter is stopping.
-
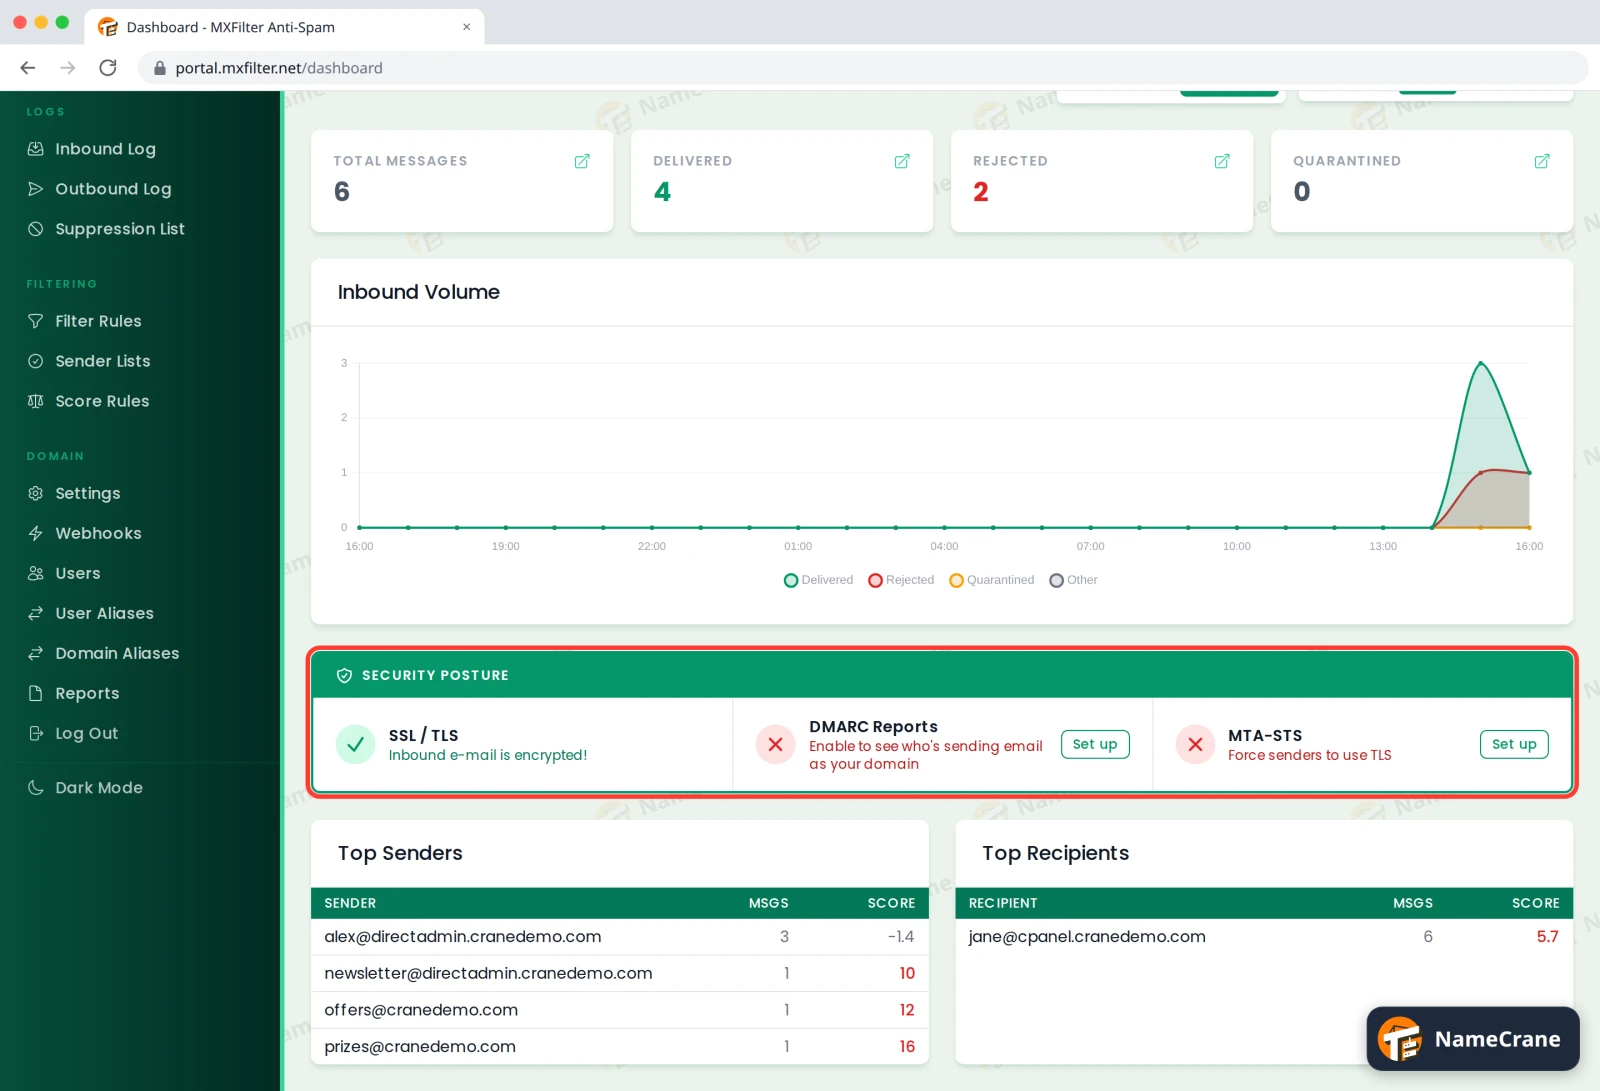
Security posture. Quick checks on your domain’s email security. A green tick means it’s done. A red cross has a Set up button that takes you to the right setting:
- SSL / TLS: whether incoming email is encrypted on the way to you.
- DMARC Reports: see who’s sending email using your domain name. See DMARC and TLS reporting.
- MTA-STS: force other servers to use encryption when they send to you. See Set up MTA-STS.
-
Top senders and recipients. Who sends you the most email, who receives the most, and their average spam score. A high score next to a sender you know is a hint that they may need allowing.
Troubleshooting
| Problem | What to do |
|---|---|
| Everything shows 0 | Try a longer time range such as 7d. If it’s still empty, your MX records may not point at MXFilter yet. See cPanel or DirectAdmin. |
| The numbers don’t match my inbox | The dashboard counts every message for the whole domain, including rejected ones you’ll never see. Use the Inbound Log to look at individual messages. |
Snagged on something? Contact support and we’ll get you sorted.